Update: so follow-on here with definions and relationsips among these topics
I posted here 3 yrs. ago among a series of DIY map notes to encourage Citizen Science, how to use NOAA global digital elevation data to model sea level rise data on straight geometry. See also here for an explanation referring to East Anglia. Here is what it looks like from the DIY document:
 |
| click to enlarge |
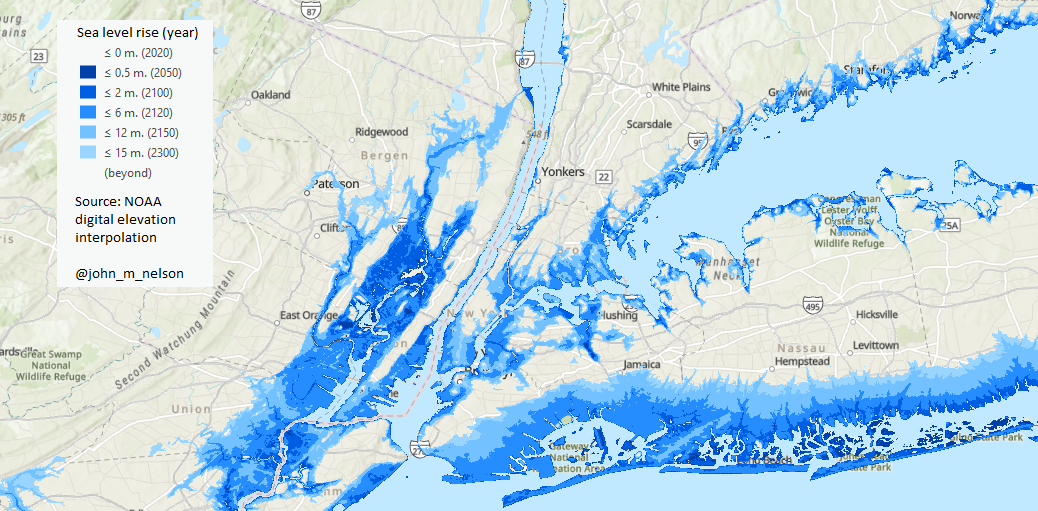
Discussing since then with Esri's John Nelson brought to my attention the same dataset online, which I then styled the same way. I was able to use this in discussing the sea level rise situation in New York as well as the current hurricane situation, by sharing these images to those non-technical, in both planar and globe view. This is what I showed from my desktop GIS:


 |
| click to enlarge |
click to enlarge
 |
| click to enlarge |
As I already had posted the NOAA digital elevation model-interpeted sea level rise map online, I simply added NOAA hurricane track data online:
Close the Legend for a better view, or go to full screen here: https://bit.ly/4dHkpmn
No comments:
Post a Comment
Thanks for reading! Please share in Comments your questions & stories...