Following on the listings in the previous post, lets revisit some blog stats Google handily collects for us! This is an update from two years ago:
... We hit the 13 year and exceeded the half million hits mark!
 |
| click to enlarge |
- the first section in Oil&Gas showed an increasing trend on hits, but a decreasing one blog post numbers (output): it shows how much work it is before the crossover point, to create a brand name after the crossover point
- the middle for-profit section was flat as I couldn't crack either oil & utilities or non-profit sectors, despite diversifying into business process re-engineering and specific tasks with high demand
- things took off and reached previous peaks in half the time with a non-profit organisation (NPO) cottenham.info owner Terry Jackson, although as before but less markedly, the decreasing trend shows the initial effort to establish the brand name
- seasonal winter dips in both hits and output are noticeable in higher volume Oil and NPO, most marked in NPO
- inevitably with exiting the social media scene mentioned before, both numbers came tumbling down
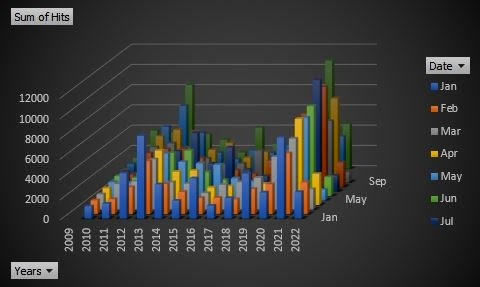
Creating a pivot table allows to show seasonal variations. In addition to the 2nd last point above, spring & fall maxima are apparent, following the business cycle of slowing down mid- & end-of-year.
 |
| click to enlarge |

No comments:
Post a Comment
Thanks for reading! Please share in Comments your questions & stories...