Community Engagement 1, ... 12, 13, 14, 15 & 16
[ Update 3: the next installment includes Environment Agency's flood defence data
Update 2: here is an update via Enviro. Agency's outreach twitter @FutureFens
Update 1: here is a story map augmenting the last two posts with live maps... enjoy! ]
Following on the previous timelines update focusing on Cambridgeshire & Peterborough Combine Authority, this is an East Anglia-wide update based on Environment Agency (EA) Survey, Office for National Statistics (ONS) Geoportal and Ordnance Survey (OS) Open Zoomstack data.
Rather than end with a slide deck as before, let's start with it for this update (ignore the blog post link that is here):
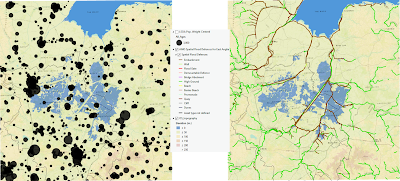
Let's spend some time now on the so-called bivariate mapping introduced above. Here is the map:
 |
| click to enlarge, full size |
To the left are ONS' 2019 Index of Deprivation (IoD) mapped against Income Rank: it shows in lighter shades the more deprived areas (as noted, lower digit is higher IoD); they center around the lowlands and peat lands to the north. To the right are Sea Level Rise modelled from OS data against Risk of Flooding lifted as-is from EA data: it shows in darker shades the areas more vulnerable to flooding from rivers or from inundation; this time they center around the central subsea areas, which as noted aren't inundated today but run the highest risk in case of inundation from sea level rise.
This quantifies the qualitative description in the Cottenham Open intro story map of peatlands shrinking during the 18th c. drainage of the Fens, thus creating a slight uphill for rivers toward the North Sea, and resulting in the drainage & pumping infrastructure dating back to that time.
 |
| click to enlarge, full size |
 |
| click ot enlarge, full size |
No comments:
Post a Comment
Please send me a copy of your prospectus to