Posted on
ArcGIS Online a 3D rendition of the Teapot Dome free 3D GIS
dataset by RMOTC and
model by me. I used Esri ArcScene from its ArcMap 3D Analyst extension. If you don't have that, then download the free ArcGIS
Explorer Desktop, and point to the layer package file
here [updated with ArcGlobe]. ArcGIS Explorer Online cannot display 3D packages, furthermore, the drop-down menu on the arcgis.com site will suggest how to access it. You can get ArcGIS Desktop for Home use with extensions for $100
here.
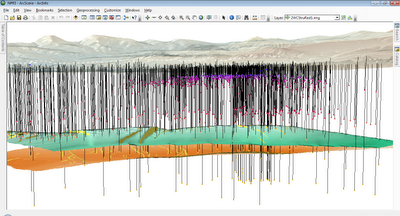 |
| click image to enlarge |
The well data are so-called measured (or z-aware) shapefiles that allows to post the TVD (true vertical depth) by colour: note two shallow purple and cyan series, the red one along the 2WCS target formation in green, and yellow ones along the Tensleep target formation in tan (see previous blogs or layer packages for details). Faults are plain (not z-aware) shapefiles draped over the surfaces.
Surfaces are step contour maps posted by RMOTC, and a future endeavour may be to find and re-contour the data into smooth surfaces.
 |
| click image to enlarge |
This has an effect on the simple reservoir model that cannot be circumvented at this time. Here is, however, a portion that depict simple flow patterns - again, please note the caveats from the previous
blog post. Please notice how the flow patterns:
- go away from the terrace (artifacts of contour images) to the faults or up-slope
- ignore the faults that did not create an appreciable step in the formation tops
Stay tuned for the next installement, as Bern Szukalski's blog post says "go through ArcGlobe to layer package 3D data". ArcGlobe is more rigorous than ArcScene on projections, and thus helps properly post data in ArcGIS Explorer for public view.


No comments:
Post a Comment
Thanks for reading! Please share in Comments your questions & stories...