[ Update: MSOA data only rolling weekly on NHSx site here or via the PHE API here
Update 2: next installment shows further marked increases in the second lockdown ]
... A lot has happened since the last update: not only may we have a second wave as seen in the bottom left-hand panel below, but also NHSx posted new Ward-level data in a format ready-to-use for coxcomb maps.
First the update: the NHSx site still carries legacy Cases data updated roughly weekly now, but no longer Death found on ONS sites described here. They allow us to do update our own dashboard:
 |
| click to enlarge or go to CamCOVIDinfo |
NHSx provided data as time series - MSOA vertically and weeks horizontally - that lends itself to Coxcomb symbology that show the COVID increase over time very effectively. Go to my story map and to my video live-stream to see how to achieve the following for Cambridgeshire Peterborough Combined Authority. Alternatively in the dashboard above, turn on the top layer following instructions at right.
Second the Ward-level data: MSOA (Middle Layer Super Output Area) you can see above are squirreled away in the ever-changing NHSx website; what you can find today, say, with maps that have tabular downloads linked, may pop up tomorrow with only a graphic link! Thanks to Google site search, look for this data by typing exactly this in your browser: site:coronavirus.data.gov.uk MSOA
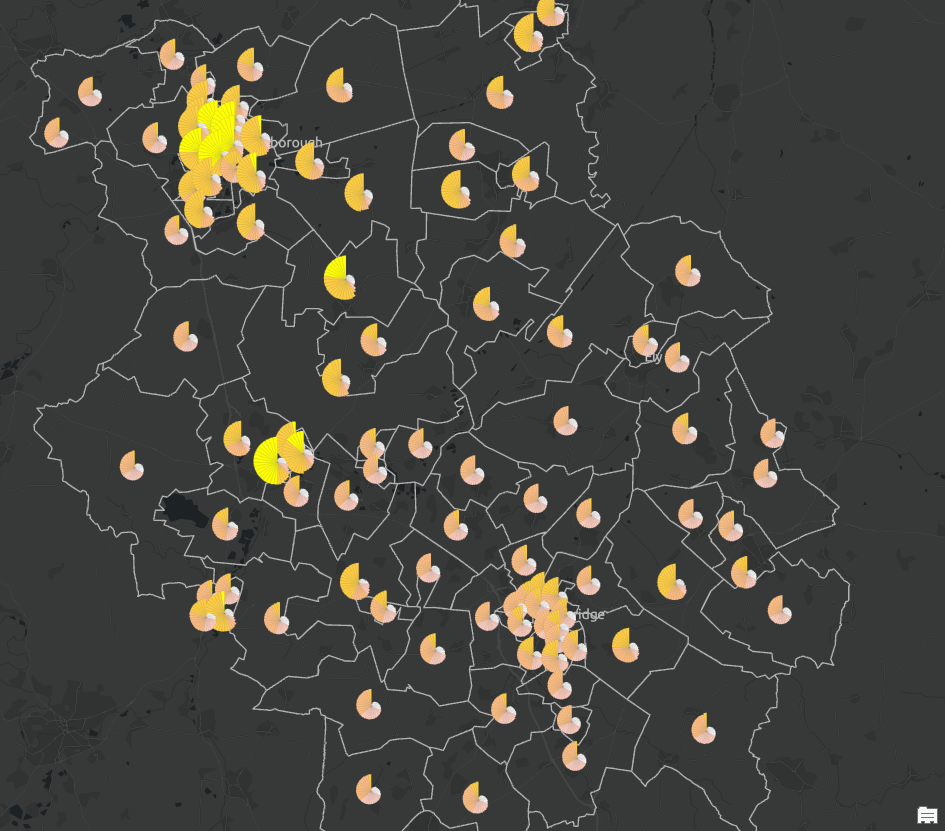 |
| MSOA (~ Ward level) COVID spread, weeks 5-40, 2020 (click to enlarge) |
See how the numbers increase more dramatically (in yellow) in some Wards than in others. This clearly augments the dashboard above, as you read its instructions on the right-hand panel.
While we're still chasing higher resolution Parish and Post Code level data, this is an improvement over UTLA (~ County-level) and above lower resolution subdivisions seen in previous posts... Stay tuned!
No comments:
Post a Comment
Thanks for reading! Please share in Comments your questions & stories...