Look at this map, and what it doesn't show is as instructive as what it shows. You guessed it, it's the low number of social media hits - anyone on the blogosphere or twitterverse would find those numbers on the low side, especially considering the passion current events in Egypt generated on the ground and online - and I wager doesn't reflect poor map making, but rather the fact the web was tampered with during the events in Egypt.
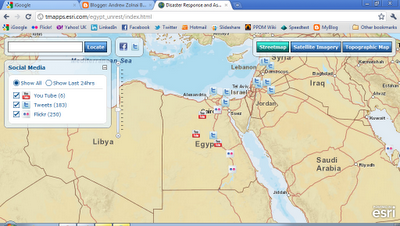
click in image to go to website
At that time reporter friend Des Kilfoil at CBC noted the influence of his newscasting on the very events he reported on - the same apparently with CNN during the Gulf War not much later - if a picture is worth a thousand words, then it's not hard to imagine the effect of maps. And web mapping with VGI increase that effect as written up elsewhere.
Later on Noam Chomsky introduced me to the concept of negative space - started as a linguist Chomsky moved rapidly onto the power of language and its use and misuse in culture and politics - we emailed over time on the different news coverage in Europe and America, and he pointed out what the news did not said is as important as what it did say.
NEWSFLASH (AP, 17 Feb 2011): US Secretary of Sate Hillary Clinton just pledged US$25M to support cyber activists...
No comments:
Post a Comment
Thanks for reading! Please share in Comments your questions & stories...