This is to show on the web or with a free desktop GIS the results of the
previous two
postings. The free data-set from
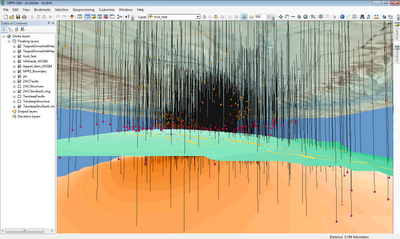
Teapot Dome is a great opportunity to display 3D petro-data in Esri. As the previous posting suggested, data were upgraded to Esri 3D Analyst ArcGlobe here.
 |
| click image to enlarge |
ArcGlobe is more rigorous in handling projections - in ArcMap or 3D Analysts' ArcScene, even Spatial Analyst's Model Builder, not fully specified projections may give an error message but will still post - not so in ArcGlobe, which in turn allows it to be posted in
ArcGIS Explorer Desktop.
[Moved a more complete treatment of ArcGIS Explorer to
next week's blog]
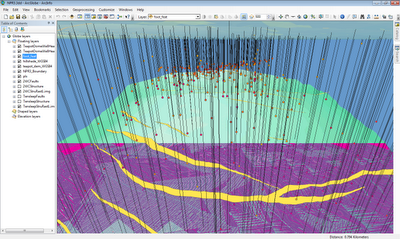
The z-aware oil well shape files shows the shallow, medium and deep colour-coding. The swipe tool also allows to show the top 2WCS and bottom Tensleep target geological formations. The reservoir model is far more detailed and is an opaque surface at that scale, but zooming in allows to see the detailed simple flow model discussed in the previous post.
 |
| click image to enlarge |
Watch next week for another installment on this series. Franco-Belgian comics, bandes dessinées were cartoon serials that ended with: to follow, À suivre...


No comments:
Post a Comment
Thanks for reading! Please share in Comments your questions & stories...