Showing posts sorted by date for query Social. Sort by relevance Show all posts

Monday, 24 March 2025

A convesation with AI (long read)

Shakira YouTube channel posted this video #LMYNLWorldTourCDMX: 


How a confusion between CDMX (Ciudad Mexico) and MCDX (1410 in Roman numerals) lead to a far-ranging AI chat thru culture, geography, career and climate activism. MSFT Copilot (here) transcript (Italics: me, regular: Copilot):

Monday, 16 December 2024

Senegal delta sea level rise map

Five friends at Arts & Metiers engineering school in Paris took a ten month leave to sail around the North Atlantic: Lez'Arts Marins (here) sail south from Britanny past the Azores & Madeira to Senegal for a moth humanitarian aid project, west across to Martinique and northeast N of Scotland to Scandinavia and back.

Tuesday, 5 November 2024

"AI for the rest of us", Part VII

Update: the last of a series, follow my recap blog post here incl. Medium Channel posts on AI.

Note: the last post on my personal Medium channel shows how I used Copilot AI to good effect for fact-checking. 

Last we showed here how to create "quick & dirty" graphs while chatting on ur mobile. Now we'll see how we can create summaries, not from "text to hand", but from that cribbed off the internet. 

Having left socials, I'm down to corresponding at Extinction Rebellion "Media Tell the Truth" WhatsApp group. Jon Fuller there is also at "Climate Genocide Act Now" here. I was a scientist for Extinction Rebellion, and blogged here about the pandemic against the lies of the British government, as well as about floods and rising sea levels in East Anglia. I didn't know GCAN, however, as I'm no longer active.

Saturday, 27 January 2024

"AI for the rest of us"

 Update: follow on Part II.

In my other blog (here) Language and mores, Part VII (here) described what I found out about my family's status as immigrants in our complex story of a pregnant mother's escape from Hungary and my siblings ½ generation later. When I later discussed how I thought my marriage ended, my family saw a Jungian influence in my thinking. Jung's disciple Adler apparently inspired Kishimi & Koga's recent best seller "The Courage to be disliked" (Google books). Ensued a three-language dicussion to understand what this was all about... Mum prefers our mother tongue Hungarian, my brother lives in Montreal and my sister in Paris.

Saturday, 20 January 2024

Community engagement and social prescribing

Community Engagement 1,... 20212223, 24 & 25

This follows an update on this blog here, where I announced my move away from Cambridge. This is also a good place to end the Community Engagement series. I will however continue on topics as they arise like re: AI here, or Sea Level Rise here & updated Thames Barrier starting here. Follow also the Blog Archive to the right-hand side of the desktop version here, as well as the right-hand side of the Banner Menu atop.

We recently rebranded Cottenham.info to Cambridgeshire.ai: the domain name is acquired but page not done yet finished; we have a prospectus as an evergreen document, meaning ever evolving.

Our community involvement over 5 years in March is one object of this blog starting  here (follow the links) and listed here. We engaged with various community interest  parties at the impact of climate change then the pandemic on social isolation in East Anglia.

Tuesday, 31 October 2023

Community Interest Company blog recap

Community Engagement 1,... 20212223 & 24

As I move away from Cambridge to SW FR in my family home, I will also exit socials and rethink my online engagement, where I lost all my pensions! I have also moved my domain to a new provider, which preserves this blog, Mind the Map and My Year in Kuwait above, but loses the superseded web page and my email now on Yahoo. I do, however, stay engaged with my Community Interest Company Cambridgeshire.ai at right. See following post here.

Monday, 30 October 2023

AI Prompt Engineering Trial 2

Community Engagement 1,... 202122 & 23

Update 2: next blog installment is here.

Update1: Medium prof channel reflects this here.

My post here, starting my experiment to convert my CIC (non profit) from Cottenham.info to Cottenham.ai, showed how can we use AI (Wikipedia) for good. My CIC started to address rural isolation in East Anglia in light of climate change and the pandemic (here and here). After a COVID hiatus forced this reassessment, the advent of AI piqued our interest beyond the hype in the press - see my companion Medium series on this topic, following four posts from The future is digital… only it’s not what you think! here - this lead into a curious interaction and my partner finding a new direction.

Wednesday, 28 June 2023

Cottenham Open CIC rebooted

Community Engagement  1, ... 12, 13, 14151617181920 & 21


Update: the next post (here) will show how a blog post on creating maps, is created by generating prompts  using Bing AI in a Udemy course on prompt engineering following STAR (style-task-audience-role).

Re-engaging après-COVID what is in LinkedIn, below & Esri HubPart 1 outlined Community Engagement. Part 2 built a story introducing the community. Part 3 tied together community maps and climate mapping. Part 4 introduced a process framework for this community engagement. Part 5 expanded on our aim toward a community engagement.  Part 6 added our own Wikipedia Gazetteer as we build up the local landscape. Part 7 showed a draft Press Release introducing our social enterprise. Part 8 on coastal inundation scenarios adds some parameters in the debate. Part 9 on temperature anomaly scenarios further constrains the debate. Part 10 followed up village engagement process via recent Parish Council update. Part 11 added flood risks to coastal inundation and temperature regime models. Part 12 described Cambridgeshire Parishes affected by sea level rise. And finally here we introduce AI with a local twist.

Tuesday, 20 June 2023

A brief history of mine

Update 2: see my journey on the web here.

Update 1: a duo of posts on my Medium professional channel here relates my early computing.

As I go through a 'hard reset' in my life and plan to exit social media, this may be a good time to pause and reflect on my IT journey.


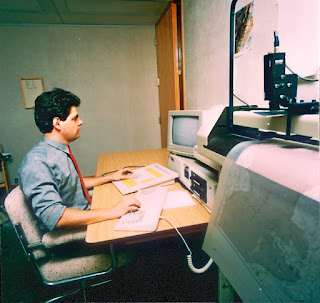
Calgary 1986 see here

Although I started on mainframes at Univ. of Calgary 1979 (here), I transitioned to desktop at Queen's Univ. (here). That post's intro lists articles illustrating the progression from geology to computer mapping and GIS. The reason I was able to do that, is that my eight years of high-school Latin allowed me to read, fix and re-run Unix scripts running petrodata management software in the oil industry, where I spent the bulk of my career.  

That then prepared me for HTML coding in the early pre-Internet days... This was 1986, 3 yrs. before Tim Berners-Lee ushered in the World Wide Web! The City of Calgary in W CAN was optically wired by the then government telephone co. AGT (now Telus) for free, betting on the fact they'd recoup the money - and they did so handsomely - via the traffic of all the oil companies jammed downtown. This was against a backdrop of the Province of Alberta having forward-looking Land Information System based in the capital Edmonton a couple hours drive north (here), but that was the heyday of early data transmission protocols (rpc)  and open binary data (EBCDIC) that opened the data flow cross province on said optical network.

Anecdote 1: as an undergrad at University of Calgary, I learned of Ted Nelson's Xanadu project (here), to catalog the world's information via what later became Hypertext Markup Language (HTML) - few people realise Tim Berners-Lee didn't invent anything, he built on exisiting systems... as we all do - but Nelson was a propeller-head who couldn't  market his idea (here). John Walker, co-founder of Autodesk, reportedly bought the technolgy but it never got anywhere... I heard of this as I was cooling my heels awaiting to meet him, with Carol Bartz his then PA - the same who eventually lead Autodesk then Yahoo, a true pioneering woman in IT - when a surveyor friend and I tried to sell them the idea of a mapping front-end to AutoCAD ... in 1986! Remember MS Windows was launched just the year before (see Side Story here and illustration here incl. photo above). Did you know I received a copy of  Windows v.1.O as part of a hardware upgrade to boost my computer's memory from 640Kb to 1Mb?! Sidebar: Was Bill Gates not famously quoted that no personal computer would ever need over 640Kb RAM  (here)?

CD-ROMs


Note that was the early to mid eighties and the web had yet ot be invented! In fact I helped launch a CD-ROM publishing firm, that put all of the Alberta well data on one CD and petroleum production info on another... using a Texas school board hashing algorithm. CDs were so rare in fact, that we leased the CD readers together with the discs themselves. Aside from the hashing algorithm, CD-ROM publishing conferences at the USGS with Gerry McFaul encouraged us to publish CD data. Another effect of pioneering CDs was that we shipped data to Dublin OH to have the CDs pressed... and US customs did not know what Exabyte data tapes were, so we shipped data as videos!

Anecdote 2: Microsoft was largely credited with popularizing CD for software distribution. While that is true, the real initiative was the US Dept. of Defense - the same people whose DARPA developed the precursor to the internet linking US military to government contractors, chiefly universities in the beginning - the reason? In the Cold War era, it was feared the Soviets might detonate an atom bomb at 5-10 mi. altitude that would fry the entire electronic infrastructure of mainland US, thus disabling the military - oh! and the rest of the country is collateral - I learned via the USGS mentioned above, that CDs were immune to resulting electromagnetic pulses.


Anecdote 3: as I had been on contract to the Geological Survey of Canada Calgary office across from the university, we visited the geological library and offered to scan the index cards to electronically catalog them on CD-ROM - after all our software came from a school library application - do you know what the librarian said then? "If we made the catalog that easily accessible, can you imagine the amount of work that might create?" We obviously had work to do, convincing a traditional business of the advantages of electronic access, taken for granted now!


Pre-WWW


Notwithstanding work on CD-ROMs, we benefited form the optical network to start building HTTP networks as we called them, as internet never mind intranet or the WWW hadn't been invented yet, not outside DARPA. My blog posts the first screenshot of an early 'website' (term as yet n/a) under 1986 at top left of the banner menu:


Progressively larger firms in the petroleum service sector took me to Texas, where we did lots of things on the nascent internet. That's when I built my first website, playing with HTML formats on my life and work stories by year, patterned after a glossary I co-authored with another counsellor. You'll recognise the website structure inherited or inspired by my first site a decade earlier:


Standards & Metadata


Parallel to this, I got involved in standards and metadata via CNC/CODATA to try and rationalize semantics of geological terms, which are quite complex. At the time the mining geological community and the USGS made some inroads, and the North American Geological Data Model emerged from that. But that was a long and arduous process that didn't come to fruition until after I switched to GIS in California in 2000. That is in turn written up in the manuscript splitting data into concepts (data taxonomy that evolve over time) and occurrence (geographic location that are fixed). In fact I took one of the geological map sheets and formatted it accordingly as an example: 


There followed a series of standards&metadata papers given at Esri and followed up on my blog and Medium channel (here, here, here, here, here, here and here) as I moved from US to UK. That put me in touch with AGI and eventually the Geospatial Commission, who have big plans supporting digital twins to enhance and enable UK infrastructure.

Volunteered Geographic Information


After I left "da awl bidness" (the oil business Texas-style) in the economic downturn, I became full time Volunteered Geographic Information as this blog is titled. I started a Community Interest Company to address East Anglia rural isolation affected by climate change and the pandemic via local community engagement. I also bird-dogged COVID polling NHS and ONS data. This is on the back of using Ordnance Survey parish data released in public domain with HC Derby Medieval Fendlands and Drainage of the Fens data to build up  a series of agro-history maps here... since Domesday in 1067! Sharing that was followed by a series on interacting with data agencies and improving their data ending here. My highlight was running a YouTube livestream on dsiplaying & tracking COVID data here.

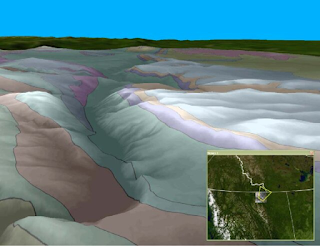
Building from that I drew a series of sea level rise maps and training materials branching into environmental issues for East Anglia re: climate change ending here. I also engaged in the new medium of story maps key along the top level menu, a professional portfolio through the Community Interest Company as well as some of personal interest. In order to help others build the same, I shared here a series of "build your own" resources. This topographic map has sea level rise calculated  from NOAA:


I also posted atop the blog my professional Medium channel on various geodata topics here. Feel free also to peruse my YouTube channel and other resources along the top level menu bar of this blog: It is only visible on the desktop version, so on mobile make sure you scroll to the bottom and select "View web version".

Saturday, 24 September 2022

"So long and thanks for the maps" - Pt. III

Following on the listings in the previous post, lets revisit some blog stats Google handily collects for us! This is an update from two years ago:

... We hit the 13 year and exceeded the half million hits mark!

Friday, 16 September 2022

Friday, 20 May 2022

Fun with puzzle maps

 Look what I found!

Having taken a vacation from work and social media, I found a puzzle box in my late Dad’s old office, while visiting my Mum:

The Puzzle of the Plates
Spilhaus Repeating World Maps
1985 American Geophysical Union 
Created by Athelstan  Spilhaus

Monday, 10 January 2022

"So long and thanks for the maps"

"So long and thanks for all the fish, I meant maps (apologies to Douglas Adams)" was the last post in my #30DayMapChallenge reported below, not incl. an extra one at the end. As my life situation has changed, however, this proved to be prophetic: I'm withdrawing from social media, activism and geo work until I sort my life out. It’s been a pleasure participating in mappy adventures with y’all. Ta for now.

Monday, 24 May 2021

East Anglia Flood Defences Final

Community Engagement  1, ... 12, 13, 14151617 & 18

[ Update: see post #19 on an opportunity to use land cover information to study peat lands

This extends the previous flood defences update into a 3D interactive map. It also explains the DEFRA flood defences data update, in order to map the infrastructure complete with various sea level rise elevations. [Story map full-page here.]

Friday, 18 December 2020

Digital Nomads and Digital Divide

 Here is the Parliament   f i n a l l y    addressing the challenges posed by the pandemic, with a fairly comprehensive review of the facts they gathered.

Monday, 7 September 2020

Sea level rise web map, poster and pirate map

[ Update 3: action in Update 1 resulted in Trinity Hall declaring divestment... hurray!
Update 2: the next post rounds this up with a Story Map that includes flood risk
Update 1: here is a video of the action mentioned below, re: colleges divest from oil ]

An Extinction Rebellion Cambridge action, demanding colleges divest from oil investment, led to a simple yet arresting idea: map the level below 12 m. sea level rise each college would be under, if climate change we left unabated, as a means to help convince them of the consequences of climate inaction.


Thursday, 13 August 2020

Blog hits and trends

[ Update: 4 mo. later saw a continuation of the trend with pretty good average stats! ]

On its 11th anniversary, let's look at blog statistics and and draw some lessons from this compilation:

  • time scale in months with employment tenure below
  • number of posts by month (orange bars, scale right)
  • top 20 individual posts (red bars, scale right)
  • blog reads per month (blue line, scale left)
  • trends (dashed) with aggregators (yellow), none (blue) and tweets (green)

Tuesday, 21 April 2020

Listen to the Scientists - Part II

[ Update: a later post shows another outreach tool, a poster depicting sea level rise scenarios ]

Part I showed web maps of London and East Anglia under 0.5, 2 and 6 m. sea level rise by mid-, end- and next century in moderate, far-tail and extreme IPCC emissions scenarios, respectively. The next post updated a simple approach to the public using paper maps, which are both visually arresting and factually correct. Videos are also an effective way to convey complex scenarios by animating those maps, and setting them in regional and local contexts. They help illustrate the climate emergency.

Monday, 16 March 2020

Coronavirus backgrounder

[Update: more dashboards local to Cambridgeshire shown in next blogpost]

This pandemic affects us all. You might be reading this from home. And while social distancing may become the norm, social isolation needn't be: Use social media, ye olde telephone, reach out! Here are some local resources gleaned from group meetings, the twitterverse and simple curiosity.

Friday, 15 November 2019

Mock Press Release

Local Community Engagement 123456 & 7


[ Updates: Part 8 on coastal inundation scenarios adds some parameters in the debate.
Part 13 is a manifesto that wraps the series together with some forward looking ideas.
"Digital nomads and digital divides" posted in Parliament late 2020 is discussed here. ]