My web presence
Sunday, 17 August 2025
A crash course on AI
Friday, 4 April 2025
One last map request
Note: this blog won't die... monthly hits almost 20K mid-April! Seen on desktop here, that also lists top reads.
Update: added a new map adding to an existing Antarctic project at the bottom
Pyrenées
When visiting the nearby village of Pontacq (Flickr & village site), the glorious sunshine showed the Pic do Midi de Bigorre (Wikipedia) so clearly we could see the observatory atop! It's the left peak in the central massif below.
Wednesday, 26 March 2025
Reposting stories from original website
As I prepare to end this blog, let's follow on recent updates:
Aug. '24: A return to my roots
Oct. '24: "Where in the world...", updated
Oct. '24: Global sea level rise revisited
Oct. '24: Northwest Passage Reloaded
Nov. '24: Cumbria classic revisited...
Dec. '24: Exhuming my thesis area... & Jan. '25: update
Jan. '25: London Thames Barrier... & Feb. '25: update
Feb. '25: Beechey Island update
Feb. '25: East Anglia Peatlands revisited
Monday, 24 March 2025
A conversation with AI (long read)
Update: a short read on Medium tells "the story behind the story" of American & French Revolutions.
Shakira YouTube channel posted this video #LMYNLWorldTourCDMX:
How a confusion between CDMX (Ciudad Mexico) and MCDX (1410 in Roman numerals) lead to a far-ranging AI chat thru culture, geography, career and climate activism. MSFT Copilot (here) transcript (Italics: me, regular: Copilot):
Wednesday, 5 February 2025
London Thames Barrier update
Update 1: here is the transcript of Hansen's latest "in plain English" (alt. here)
Update 2: here is the Climate Cultures article this map was used in, thanks Lola Perrin.
Update 3: here at the end is the relevance of this sort of effort in a broader context
Two weeks ago I recreated Sea Level Rise (SLR) and Risk of Flooding (RoF) maps for the lower Thames River near the Thames Barrier (blog) for a WhatsApp Group considering the future of its ageing infrastructure w.r.t. recent climate extremes. This week came a global and urgent update affecting Sea Level Rise, by James Hansen who sounded the alarm ~ 35 yrs ago (go to 1981 & 1988 in Medium): a paper incl. supplementary materials "Global Warming Has Accelerated" (Columbia) c/w companion webinar (Columbia).
Tuesday, 21 January 2025
London Thames Barrier revisited
Update 2: see renewed Sea-level Rise extents according to new information here
Update 1: see addition at bottom... thanks to our indefatigable London climate activists!
Further to my original blog post 3½ yrs. ago here, I was asked to share maps of the area surrounding the Thames Barrier (Wikipedia): A WhatsApp group considered the necessity for a second barrier under Climate Change that increases both flooding and sea level seasonal elevations.
Monday, 16 December 2024
Senegal delta sea level rise map
Five friends at Arts & Metiers engineering school in Paris took a ten month leave to sail around the North Atlantic: Lez'Arts Marins (here) sail south from Britanny past the Azores & Madeira to Senegal for a moth humanitarian aid project, west across to Martinique and northeast N of Scotland to Scandinavia and back.
Saturday, 12 October 2024
Hurricanes, tornadoes and sea level rise
Update: see @ bottom example of a Cyclone (Wikipedia) as they're called in the So. Hemisphere.
Further to our explorations in AI here and to the previous post here, this is a 'conversation' with Copilot, Microsoft Bing's AI extension. Conversation means that you can daisy-chain questions without repeating them, either to extend or to zero in:
Friday, 11 October 2024
Global sea level rise revisited
Update: so follow-on here with definions and relationsips among these topics
I posted here 3 yrs. ago among a series of DIY map notes to encourage Citizen Science, how to use NOAA global digital elevation data to model sea level rise data on straight geometry. See also here for an explanation referring to East Anglia. Here is what it looks like from the DIY document:
Monday, 2 September 2024
Global harmonization of climate & temperature data since 1850
Update: a post in SciTech Daily shows that ocean atmospheric science - shown in this and previous post - is alive and may help with assessing climate change: it's about the doldrums driven by downdrafts not updrafts; at a localized scale, downdrafts were dramatically reported in passenger flight incidents here or the sinking off Sicily of a superyacht here, and updrafts in increasing mid-Atlantic hurricane generation here.
Friday, 23 August 2024
A return to my roots
Updates: mapping climate data from historic ships & global harmonization follow respectively here & here.
"You can get Andrew outa maps, but you can't get maps outa Andrew" quipped a GIS map friend when I left Kuwait a dozen years ago... Well after quitting socials, Esri(UK) graciously helped me recover my desktop app. While I lost my story maps and web maps content, I maintained a free dev account - story maps and maps&data - this was chiefly to preserve my Living Atlas content inspired by John Nelson.
Saturday, 20 January 2024
Community engagement and social prescribing
Community Engagement 1,... 20, 21, 22, 23, 24 & 25
This follows an update on this blog here, where I announced my move away from Cambridge. This is also a good place to end the Community Engagement series. I will however continue on topics as they arise like re: AI here, or Sea Level Rise here & updated Thames Barrier starting here. Follow also the Blog Archive to the right-hand side of the desktop version here, as well as the right-hand side of the Banner Menu atop.
We recently rebranded Cottenham.info to Cambridgeshire.ai: the domain name is acquired but page not done yet finished; we have a prospectus as an evergreen document, meaning ever evolving.
Our community involvement over 5 years in March is one object of this blog starting here (follow the links) and listed here. We engaged with various community interest parties at the impact of climate change then the pandemic on social isolation in East Anglia.
Wednesday, 11 October 2023
"So long and thanks for the maps", Part IV
Over 1½ yrs. ago Part I said that I left socials and geo work... well not quite! I did quit all activism and will soon return to my family home in France left almost 50 yrs. ago.
I left now by entering the 2023 Story Map competition with "a story about conserving Earth’s lands and waters": East Anglia Fenlands: Peatlands Restoration to mitigate Climate Change sums up my work in East Anglia under Cottenham Open - introduced here 4½ years ago as Local community engagement - you can follow my professional portfolio either at top right of my blog home in desktop mode, or my story map direct.
Wednesday, 28 June 2023
Cottenham Open CIC rebooted
Community Engagement 1, ... 12, 13, 14, 15, 16, 17, 18, 19, 20 & 21
Monday, 26 June 2023
Sea Level Rise update
The last post before peatlands (recent update here) was the East Anglia flood protection infrastructure here - both used extensive Environment Agency data, publicly available if needing some (at time extensive) work as described therein. Here are further DIY resources to create maps like this fun pirate map of East Anglia under 12 m. water est. around 2150AD (from here updated here):
Friday, 23 June 2023
Community, climate and maps - an update
Update: see a follow-on post to sea level rise in East Anglia here.
This is a follow on to this post: lets address one of the update items, Fire & Ice, in the light of an early and vicious start to the Canadian fire season. The question is: notwithstanding this year's events, is there an increase in fires and if so, can they be related to climate change as, say, in California?
Tuesday, 20 June 2023
A brief history of mine
Update 2: see my journey on the web here.
Update 1: a duo of posts on my Medium professional channel here relates my early computing.
As I go through a 'hard reset' in my life and plan to exit social media, this may be a good time to pause and reflect on my IT journey.
 |
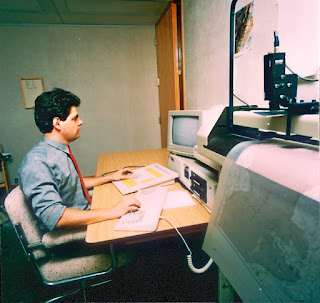
| Calgary 1986 see here |
Anecdote 1: as an undergrad at University of Calgary, I learned of Ted Nelson's Xanadu project (here), to catalog the world's information via what later became Hypertext Markup Language (HTML) - few people realise Tim Berners-Lee didn't invent anything, he built on exisiting systems... as we all do - but Nelson was a propeller-head who couldn't market his idea (here). John Walker, co-founder of Autodesk, reportedly bought the technolgy but it never got anywhere... I heard of this as I was cooling my heels awaiting to meet him, with Carol Bartz his then PA - the same who eventually lead Autodesk then Yahoo, a true pioneering woman in IT - when a surveyor friend and I tried to sell them the idea of a mapping front-end to AutoCAD ... in 1986! Remember MS Windows was launched just the year before (see Side Story here and illustration here incl. photo above). Did you know I received a copy of Windows v.1.O as part of a hardware upgrade to boost my computer's memory from 640Kb to 1Mb?! Sidebar: Was Bill Gates not famously quoted that no personal computer would ever need over 640Kb RAM (here)?
CD-ROMs
Anecdote 2: Microsoft was largely credited with popularizing CD for software distribution. While that is true, the real initiative was the US Dept. of Defense - the same people whose DARPA developed the precursor to the internet linking US military to government contractors, chiefly universities in the beginning - the reason? In the Cold War era, it was feared the Soviets might detonate an atom bomb at 5-10 mi. altitude that would fry the entire electronic infrastructure of mainland US, thus disabling the military - oh! and the rest of the country is collateral - I learned via the USGS mentioned above, that CDs were immune to resulting electromagnetic pulses.
Anecdote 3: as I had been on contract to the Geological Survey of Canada Calgary office across from the university, we visited the geological library and offered to scan the index cards to electronically catalog them on CD-ROM - after all our software came from a school library application - do you know what the librarian said then? "If we made the catalog that easily accessible, can you imagine the amount of work that might create?" We obviously had work to do, convincing a traditional business of the advantages of electronic access, taken for granted now!
Pre-WWW
Standards & Metadata
Volunteered Geographic Information
Wednesday, 14 December 2022
More fun with Maps
Monday, 10 January 2022
"So long and thanks for the maps"
Friday, 19 November 2021
Satellite data help for local housing issue
The #30DayMapChallenge Day 23 challenge is "GHSL data", here is the section in the story map that will chronicle the map challenge when it's finished:
Global Human Settlement for Northstowe controversial development NW of Cambridge UK, monitoring housing probability (GHS-BUILT-S2, 2018) and housing footprint (GHSL-ESM, 2015) against Esri 2020 Land Cover map extract with OpenStreetMap detailed base-map. Various blended overlays 'bake' the layers into a screen pattern allowing to compare and contrast past built areas vs. currently probably built against submissions.


